Background / Problem
- Objective: Maximize App traffic (unique sessions) and session purchase rate (S.P.%) within a provided budget across Meta, Google, and TikTok.
- Challenge: Platforms performed differently in terms of cost efficiency and purchase conversion.
Actions Taken
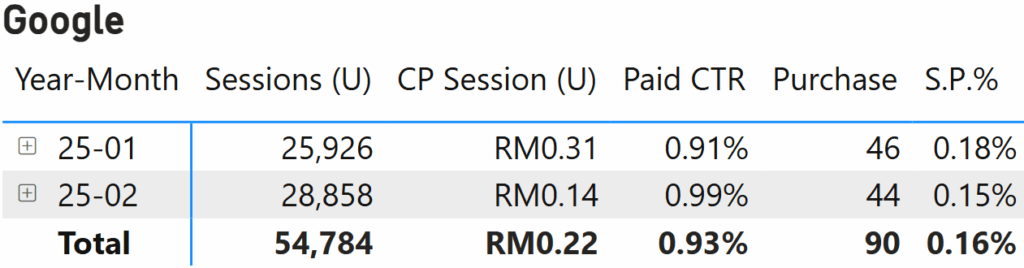
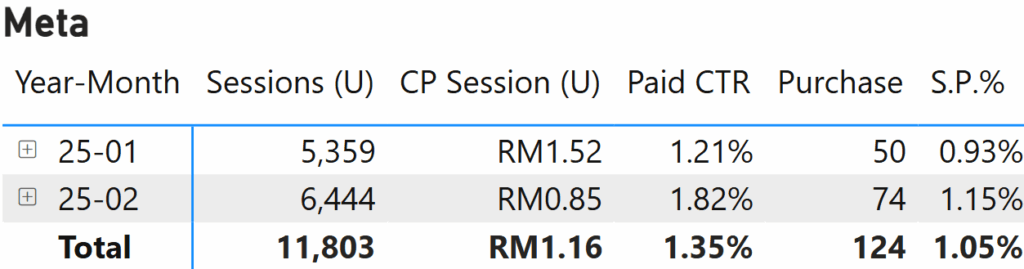
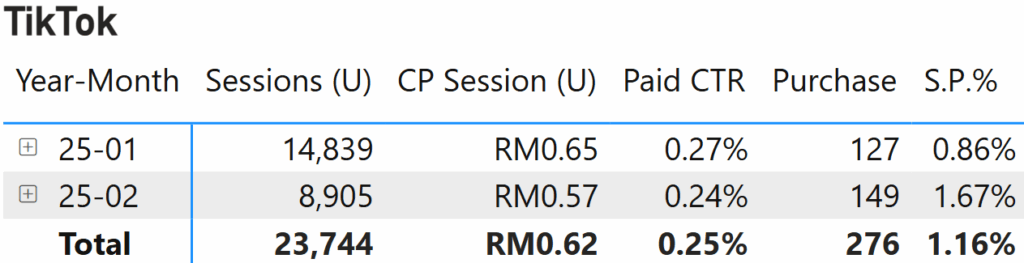
- Compared Sessions (U) and CP Session (U) across platforms.
- Reviewed S.P.% (U) to measure traffic quality (likelihood to convert).
- Evaluated Google as the top traffic generator, Meta as strong purchase driver, and TikTok as emerging traffic source.
- Implemented budget reallocation model:
- Increased spend on Google for volume.
- Strengthened Meta Sales campaigns for conversions.
- Kept TikTok for incremental reach and younger audience acquisition.
Results / Impact
- Google: 28,858 Sessions (U), strong traffic driver but moderate purchase rate (~0.15–0.18%).
- Meta: 6,444 Sessions (U), lower traffic but better S.P.% (~0.93-1.15%).
- TikTok: 8,905 Sessions (U), with growing efficiency in engagement and future scaling potential.
- Budget Optimization Outcome:
- Weighted allocation (Google 30% | Meta 35% | TikTok 35%).
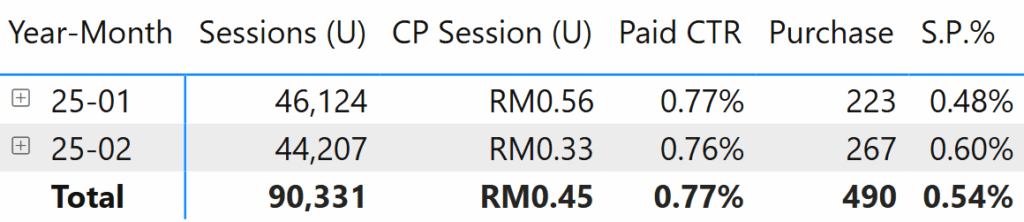
- Overall CP Session reduced by ~48%.
- Session Purchase Rate increased from 0.48% → 0.60%.
Resulting in +20% uplift in purchases with decreasing total spend by 40%.